Facebook Ads vs Google Ads for Insurance Agencies: Which Wins?
For insurance agents, Google Ads captures people already searching for coverage — high intent, higher cost, lower volume. Facebook and Instagram ads interrupt people who were not looking — lower intent, cheaper leads, higher volume. Search suits complex or urgent lines; social suits simple, emotional ones like final expense. Running both is the mature answer.
Agents ask “Facebook or Google?” as if one platform is simply better. It is the wrong question. Google and Facebook are not two versions of the same tool competing to win — they are two fundamentally different motions. One captures demand that already exists. The other creates demand that did not. Understanding that split answers almost every version of the question, including which one fits your line.
We have step-by-step build guides for each channel — how to set up Google Ads for insurance agents and how to run Facebook ads for insurance agents. This piece is the strategic comparison: which motion fits which line, budget, and buyer, what each one costs in numbers somebody published, and why the two dashboards cannot be added together.
The core difference: capture vs create
Google Ads is demand capture. Someone types “cheap auto insurance near me” or “Medicare plans 2026.” They are already in the market. You pay to be the answer at the moment of intent. That intent makes the lead more likely to convert — and more expensive, because you are bidding against every other agent who wants the same searcher. Volume is capped by how many people are searching.
Facebook (and Instagram) is demand generation. Nobody opens Facebook to buy insurance. You interrupt them — a scrolling grandparent, a young parent, a new homeowner — with a message that creates the want. Leads are cheaper and far more plentiful, but colder. The person was not looking, so intent has to be manufactured by your creative and confirmed by your follow-up.
Everything else on this page follows from that one split. The cost gap follows from it. The targeting rules follow from it. Even the attribution mismatch at the bottom of the page follows from it, because a platform that credits an impression and a platform that credits a query are not measuring the same act.
Side-by-side: the honest tradeoffs
| Factor | Google Ads | Facebook / Instagram Ads |
|---|---|---|
| Motion | Capture existing demand | Generate new demand |
| Intent | High | Low to moderate |
| Cost per lead | Higher | Lower |
| Lead volume | Capped by search volume | Large, scalable |
| Best-fit buyer | Actively shopping / urgent | Emotional, awareness-driven |
| Targeting control | Keywords, location | Creative-led; limited by Special Ad Category |
| Follow-up pressure | Moderate | High — cold leads decay fast |
| First lever we pull | Bids and keywords | Creative and speed to lead |
The last two rows are the ones agents skip. Facebook leads are cheap and perishable — a low-intent lead you call two hours late is often worthless. The channel that looks cheaper per lead can quietly become the more expensive one per sale if your follow-up is slow.
What each platform costs, in numbers somebody published
Benchmarks are not your numbers. They are the only public floor you can plan against before you have your own, and two published reports cover this comparison directly.
LocaliQ’s 2026 search advertising benchmarks draw on thousands of its customers’ Google Ads and Microsoft Ads campaigns. WordStream’s 2025 Facebook ads benchmarks draw on 554 US traffic-objective campaigns and 726 US leads-objective campaigns running between April 1, 2024 and June 30, 2025, and the report notes that its “averages” are technically median figures to account for outliers.
Every figure below is published; the two reports are different samples from different periods, so read down the columns rather than subtracting across them.
| Metric | Google / Microsoft search | Meta |
|---|---|---|
| Cost per click, Finance & Insurance | $3.39 | $1.22 (traffic objective) |
| Click-through rate, Finance & Insurance | 9.83% | 0.98% (traffic objective) |
| Conversion rate, Finance & Insurance | 2.64% | Not published |
| Cost per lead, Finance & Insurance | $74.44 | Not published |
| Cost per click, all industries | $5.42 | $1.92 (leads objective) |
| Conversion rate, all industries | 8.18% | 7.72% (leads objective) |
| Cost per lead, all industries | $66.69 | $27.66 (leads objective) |
Two things in that table deserve more than a glance.
Insurance is one of the few categories that beats the all-industry click-through rate on search and undershoots it on social. On search, Finance and Insurance clicks at 9.83% against an all-industry 6.64%. On Meta traffic campaigns, the same category clicks at 0.98% against an all-industry 1.71% — one of the three lowest CTRs in that report, alongside Automotive repair at 0.80% and Physicians and Surgeons at 0.83%. That is the capture-versus-create split rendered as a percentage. The searcher already wants what you sell. The scroller does not yet.
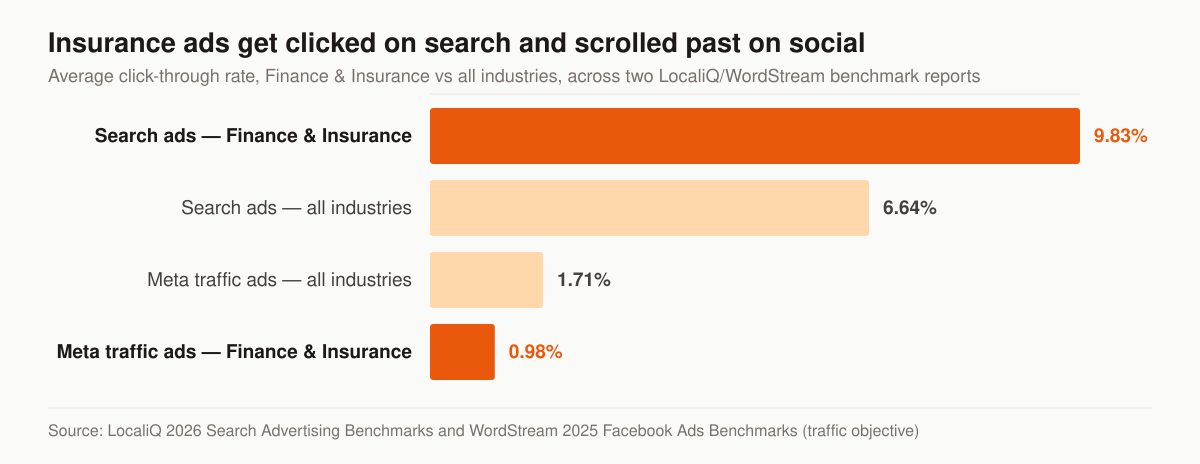
Average click-through rate by platform and category. Sources: LocaliQ, 2026 Search Advertising Benchmarks for the search rows and WordStream, Facebook Ads Benchmarks 2025 for the Meta rows (traffic objective, 554 US campaigns, April 2024 to June 2025).
The Meta cost-per-lead number everyone quotes is not an insurance number. WordStream’s leads-objective tables cover fifteen business categories — Arts and Entertainment through Sports and Recreation — and Finance and Insurance is not among them. So the widely repeated $27.66 is the all-industry median for lead ads, and the only insurance-specific Meta figures published there sit on the traffic side, where the category carries the highest cost per click in the report at $1.22. Anyone quoting a precise Facebook cost per lead for insurance is quoting something other than that report.
Within the WordStream report itself, the platform comparison is stated directly: Meta lead-ads cost per click at $1.92 against $5.26 on Google Ads, and Meta lead-ads cost per lead at $27.66 against $70.11 on Google Ads. Those Google figures are the ones WordStream cites for comparison inside its 2025 Facebook report, and they are not the same figures as the 2026 search report in the table above — which is why two different Google cost-per-lead numbers appear on this page. Vintage matters here, because the same report puts Meta’s lead-ads CPL up 20.94% year over year, from $22.87.
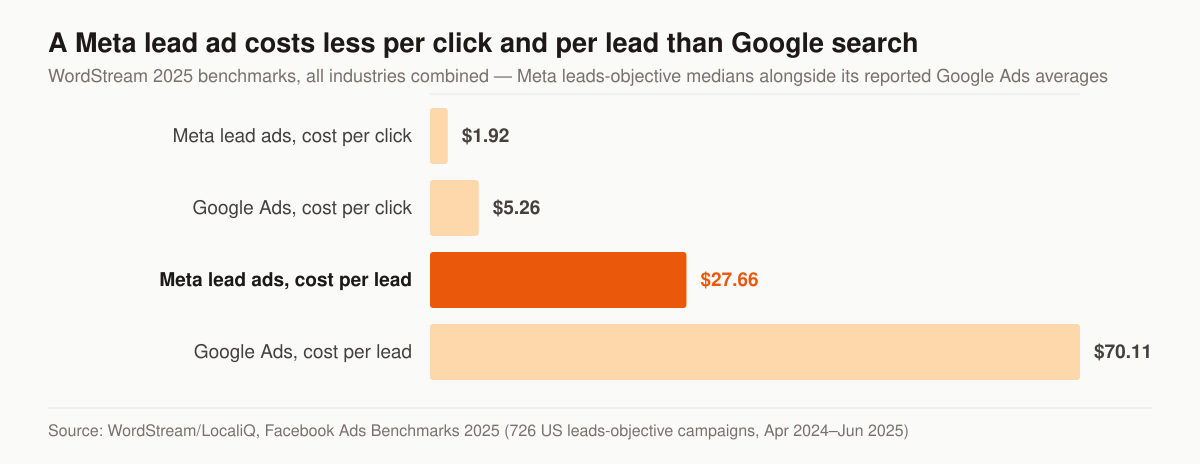
Cost per click and cost per lead, all industries combined. Source: WordStream/LocaliQ, Facebook Ads Benchmarks 2025, 726 US leads-objective campaigns, shown alongside the Google Ads averages reported in the same article.
For head-term rate cards by line rather than blended account averages, see our breakdown of insurance PPC cost per click by line — a category average of $3.39 bundles cheap brand and long-tail terms in with the keywords you actually want.
Google’s ceiling is search volume. Facebook’s is creative.
The two channels fail in different directions when you push them, and the reason is structural.
Google’s inventory is queries. If nobody in your market types the thing you sell, the auction has nothing to sell you, and no amount of budget invents a searcher. Google’s own Keyword Planner documentation defines average monthly searches as “The average number of times people have searched for a keyword and its close variants based on the month range as well as the location and Search Network settings you selected,” and warns that “Your search volume statistics are rounded.” Rounded and averaged, but knowable — which is the point. The size of your Google opportunity is measurable before you spend a dollar, and checking it is a twenty-minute job you can do while the account is still empty.
That makes search-volume research the first honest test of whether Google belongs in your plan at all. A line with thin query volume in your footprint is not a line search will scale; it is a line where search catches the few high-intent researchers and something else has to carry the rest. Our guide to insurance SEO keywords covers how to read the volume data for agency terms, and the same numbers govern the paid side.
Facebook has no query ceiling, because there is no query. Its ceiling is how many people your creative can move, and Meta’s Special Ad Category guidance pushes you toward a wider audience rather than a tighter one: “We encourage you to broaden—not restrict—your audience.” That is the trade. Search hands you a small pool of people who already raised their hand. Social hands you an enormous pool of people who have not, and asks your creative to do the raising.
Two practical consequences fall out of it:
- On Google, the constraint is upstream of the account. You cannot fix low volume with better ads, better bids, or a bigger budget. You can only find adjacent queries or accept the ceiling.
- On Facebook, the constraint is your creative queue. A senior-market audience burns through creative because the addressable pool is small relative to the impressions you buy against it, so the next three variations need to exist before the current one fatigues.
What a real test costs before the numbers mean anything
Competitors publish minimum budgets as round numbers. Both platforms document the mechanic that actually sets the floor, and the mechanics are different, which is why one shared number would be wrong for both.
On Meta, the floor is the learning phase. Meta’s documentation says the delivery system “is exploring the best way to deliver your ad set when you either create a new ad or ad set or make a significant edit to an existing one,” that ad sets “exit the learning phase as soon as they can deliver stably,” and that this “usually occurs after about 50 results in the week after the ad set’s last significant edit.” An ad set that cannot reach that volume shows a Delivery status of “Learning limited.” So the weekly floor for one ad set is fifty times whatever a result costs you — and Meta’s own advice is to “Use realistic budgets,” warning that “If you set a very small or inflated budget, the delivery system has an inaccurate indicator of the people for whom the delivery system should optimize.” Underfunding three ad sets is worse than funding one.
On Google, the floor is data volume against a documented spend curve. Google Ads Help is explicit that an average daily budget is an average and not a cap: “on some days you might not reach your average daily budget, and on others you might exceed it.” Two limits bound it — a daily spending limit of “two times your average daily budget for most campaigns on any particular day” and a monthly spending limit of “30.4 times your average daily budget for most campaigns in any particular month.” So you set the monthly number you can live with, divide by 30.4, and stop panicking at the heavy Mondays.
Each platform’s own documentation sets its own floor; neither floor is a dollar figure until you fill in your own cost per result.
| Meta | Google Ads | |
|---|---|---|
| What sets the floor | Learning phase: about 50 results per ad set per week | Enough clicks per ad group for the conversion data to mean something |
| The arithmetic | 50 × your cost per result, per ad set, per week | Monthly budget ÷ 30.4 = the average daily budget you enter |
| Documented spend behaviour | Budget changes can reset the learning phase | Up to 2× the daily average on a day, 30.4× in a month |
| Failure signal in the dashboard | Delivery reads “Learning limited” | Ad groups with too few clicks to read |
| The mistake it punishes | Splitting a small budget across several ad sets | Judging bids on a two-day sample |
Neither floor tells you whether the spend was worth it. That answer lives in your CRM, not in either dashboard, which is the whole argument of our piece on true cost per sale versus headline lead price. If you are still sizing the overall number, our insurance agency marketing budget guide works from revenue backwards rather than from a benchmark forwards.
Targeting: what you actually control on each side
The instinct that both platforms offer “targeting” hides how differently they behave for a licensed agent.
Google lets you narrow toward intent: keywords, match types, a negative list, geography, schedule, device. Meta, once a campaign is flagged under the financial products and services Special Ad Category, takes most demographic narrowing away. Meta’s own page states that for these ads, “Certain audience options are limited or unavailable for these ads for advertisers based in or reaching the US and advertisers reaching Canada and certain countries in Europe: age, gender, ZIP code or postal code, exclusion targeting, lookalike audiences and saved audiences,” that “Some interests will also be unavailable when you create your audience,” and that “Audiences based on city or pin drop locations will include an expanded radius.”
Left column is the lever; the middle and right columns are what each platform will actually let a licensed agent do with it.
| Lever | Google Ads | Meta under the Special Ad Category |
|---|---|---|
| Who sees the ad | Chosen by query, through keywords and match types | Chosen by the delivery system; you supply creative and a broad audience |
| Age and gender | Not the primary lever; available as bid adjustments | Limited or unavailable per Meta’s page |
| Geography | Down to the level you set, with presence-only targeting | City or pin drop expands the radius; ZIP or postal code unavailable |
| Excluding people | Negative keyword lists, from day one | Exclusion targeting unavailable |
| Lookalike modelling | Not applicable | Lookalike audiences unavailable |
| Saved audiences | Not applicable | Unavailable per Meta’s list |
| The lever that remains | Query intent plus negatives | Creative that self-selects the right reader |
Read the right-hand column as a strategy rather than a handicap. When you cannot hand-pick the audience, the ad copy becomes the filter, and a specific offer filters harder than a demographic checkbox ever did. The full build-side version of that argument is in how to run Facebook ads for insurance agents; the query-side equivalent — negatives, match types, presence-only geography — is in how to set up Google Ads for insurance agents.
Which channel fits which line
- Final expense → lean Facebook/Instagram. Seniors rarely search for it, but they respond to an emotional, well-targeted social ad. This is a demand-generation sale. Google has a supporting role for high-intent “burial insurance” searches, and our teardown of whether final expense PPC is worth it covers where that supporting role stops paying.
- Medicare → both, timed to the enrollment calendar. Search intent spikes around AEP; social sustains awareness and reaches the turning-65 audience year-round. Every ad must follow CMS rules — read our scope of appointment and TPMO compliance guide before you spend a dollar on Medicare traffic.
- Auto and home → Google usually leads. These are urgent, search-driven, price-comparison purchases. Social plays a supporting awareness and retargeting role; where an agent wants to push social on auto anyway, the creative shifts, which is why we wrote how to run Facebook ads for auto insurance agents separately.
- Life, IUL, mortgage protection → social generates the top of the funnel (young families are on Facebook, not searching for IUL), while Google catches the smaller pool of high-intent researchers. The mortgage protection Facebook ads guide walks the social side of that line end to end.
The pattern underneath the list is simple enough to apply to a line we did not name. Ask whether a buyer in need would type something specific into a search box. If they would, search has inventory to sell you. If they would not — because they do not know the product exists, or would not name it if they did — the demand has to be created, and that is social’s job.
Medicare is the line where the calendar and the rulebook decide the split
Medicare is the one place where the platform question is genuinely secondary. Two things outrank it.
The first is the calendar. Search intent concentrates around the annual enrollment period, and social carries the year-round awareness and turning-65 work between those windows. Budgeting flat across twelve months buys peak-season CPMs out of season and underfunds the weeks that matter; our Medicare AEP marketing strategies piece lays out that calendar.
The second is CMS, and it applies to both platforms identically. Under 42 CFR 422.2267(e)(41) — the Medicare Advantage communication rules; Part D’s parallel provisions live in Part 423 — a third-party marketing organization that does not sell for every MA organization in the service area must use this standardized disclaimer: “We do not offer every plan available in your area. Currently we represent [insert number of organizations] organizations which offer [insert number of plans] products in your area. Please contact Medicare.gov or 1-800-MEDICARE to get information on all of your options.” A TPMO that does sell for all MA organizations in the service area uses a different standardized statement given in the same paragraph.
The conditions attached to it are what make it a paid-media problem rather than a call-script problem. CMS requires the disclaimer to be used by any TPMO “that sells plans on behalf of more than one MA organization,” and to be:
- “Verbally conveyed during sales calls prior to the discussion of any benefits.”
- “Electronically conveyed when communicating with a beneficiary through email, online chat, or other electronic means of communication.”
- “Prominently displayed on TPMO websites.”
- “Included in any marketing materials, including print materials and television advertisements, developed, used or distributed by the TPMO.”
A Facebook instant form and a Google landing page both sit inside that scope, which is why the compliance work does not get cheaper by picking the other platform. Our guide to CMS Medicare marketing rules for agents covers the wider set. This is a summary of published rules, not legal advice; confirm application with your compliance counsel.
Compliance shapes the platforms differently
The two channels constrain you in different ways. On Facebook, insurance ads run under Meta’s financial products and services Special Ad Category — Meta’s page states that “Starting January 21, 2025, using this category is required for financial products and services campaigns for advertisers based in the United States or showing ads to audiences in the United States,” and that “Ads may be rejected if an appropriate category is not chosen.” Meta’s Marketing API documentation spells out what selecting it does to an ad set: age “Options are generally fixed to include ages 18 through 65+,” “Specific gender cannot be chosen,” “Location exclusion is not supported,” “Location selection must include all areas equal or larger than 15 mile or 25 kilometer radius for the US and Canada,” zips and neighborhood are among the location categories listed as not supported, and “Lookalike audiences are unavailable for housing, employment, and financial products and services ads.” You win on creative and the algorithm, not micro-targeting.
On Google, the constraint sits on the account and the page rather than on the audience. Google’s financial products and services advertising policy tells advertisers “You’re required to complete a verification process to advertise financial services in some locations,” and lists disclosures including “The physical address for the business offering the financial product or service” and “All associated fees,” which must be “clearly and immediately visible without needing to click or hover over anything.” For Local Services Ads the gate is heavier still — screening and licensing before a single lead — and our breakdown of Local Service Ads for insurance agents covers whether that pay-per-lead format fits your line.
The same word, compliance, points at a different object on each platform.
| What gets policed | Meta | Google Ads |
|---|---|---|
| The audience | Special Ad Category strips age, gender, ZIP, exclusions and lookalikes | Largely unrestricted; you narrow by query and geography |
| The creative | Ad review against Meta’s advertising standards | Ad review, plus disclosure requirements on the destination |
| The advertiser | Category selection at campaign creation | Verification process for financial services in some locations |
| The landing page | Consent language and the form you built | Physical address and all associated fees, immediately visible |
| Medicare traffic | TPMO disclaimer applies | TPMO disclaimer applies |
And across both, Medicare traffic must carry that disclaimer and honest claims. A cheap lead generated non-compliantly is not a bargain; it is a liability. The wider picture is in our guide to insurance marketing compliance for agents.
The two dashboards do not count the same event
This is the part that quietly decides most Facebook-versus-Google arguments, and neither platform hides it — the definitions are published, they just do not match.
Meta’s standard attribution setting lets you credit a conversion to an impression, a click or an engagement, within windows Meta defines precisely: “Click-through: Counts events that occurred within 1-day or 7-day after a link click on your ad.” “View-through: Counts events that occurred within 1-day after an impression of your ad.” “Engage-through: Counts events that occurred within 1-day after a non-link click action on your ad.” Meta adds a warning worth reading twice: “Results cannot be compared in the Campaign Overview table across ad sets with different attribution models,” because “Each attribution model uses different counting mechanisms, and comparing across different attribution models will lead to inaccurate conclusions.” If Meta says you cannot compare two of its own ad sets across models, comparing its dashboard to Google’s is a longer reach.
Google’s equivalent is the conversion window, which it defines as “the period of time after an ad interaction (such as an ad click or video view) during which a conversion, such as a purchase, is recorded in Google Ads,” with a default click-through window of 30 days and a range you set yourself. An insurance sale that takes six weeks to underwrite and issue can fall outside that default entirely — the conversion happened, Google never heard about it, and it keeps bidding as though the keyword produced nothing.
Put the two definitions side by side and the reason your totals disagree stops being mysterious.
| Question | Meta | Google Ads |
|---|---|---|
| Does an impression alone earn credit? | Yes, under the 1-day view-through setting | No — the window runs from an ad interaction |
| Default click-through window | 1-day or 7-day after a link click | 30 days, adjustable |
| Can two setups be compared inside the platform? | Meta says no across different attribution models | Comparable only where the window matches |
| Where a six-week insurance sale lands | Outside a 7-day click window | Outside a 30-day default window |
| Whose count should you trust | Neither, on its own | Neither, on its own |
The operational fix is not clever, and it is the same fix in every channel we run. Pick one system of record — the CRM — stamp every lead with the source and the click identifier at the moment it arrives, and settle every argument on cost per issued policy measured there. Our comparison of the best CRM for insurance agents covers which systems take the platform webhooks natively, and the insurance lead follow-up cadence covers what happens between the lead landing and the policy issuing.
Until that exists, the honest position is that you do not know which platform is winning. Two dashboards each claiming the same sale is not evidence; it is arithmetic applied to overlapping definitions.
The real answer: run a portfolio, in the right order
For an established agency the mature answer is both, because they do complementary jobs — Google harvests the buyers already looking, Facebook fills the long gaps between those moments and keeps the pipeline warm. But sequencing matters if you are budget-constrained:
- Start with the channel that fits your primary line (social for final expense, search for auto).
- Prove cost per issued policy, not cost per lead, on that one channel.
- Add the second channel once the first is tracked and profitable, using it for the job the first does poorly.
- Coordinate creative and offers so search and social reinforce the same message.
Running both introduces three problems that running one does not, and they are worth planning for before they appear:
- The same person arrives twice. Someone who sees a Facebook ad on Tuesday and searches your agency name on Thursday is one prospect and two leads. Deduplicate on phone and email at the CRM, not in a spreadsheet at month end.
- Both dashboards claim the same sale. That is the attribution mismatch above, and it does not resolve itself — it resolves when one system of record outranks both platforms.
- The two calendars drift. Search budget follows the auction; social creative follows fatigue. Left alone they end up promoting different offers in the same month, which is a brand problem before it is a performance problem.
If you want this built and managed as one system — creative for social, campaign structure for search, and tracking that ties both to sold policies — that is the core of our insurance social media advertising and PPC management work — budgeted together against one cost-per-sale number under our insurance advertising program rather than as two separate line items. A free marketing audit will tell you which motion your specific line and market should lead with.
What it costs to have someone else run both
Our programs are productized rather than quoted per campaign. Foundation is $2,500 per month, Growth is $3,500, and Full-Funnel is $5,500. Managed paid ads across Google and Meta sit in the Full-Funnel tier, alongside landing-page CRO and marketing automation — deliberately, because the benchmark data above puts the category’s search conversion rate at 2.64% against an 8.18% all-industry average, and buying more traffic into the page that produces a gap like that is the expensive way to discover it. A one-time website build runs $2,500 to $8,000. Ad spend is never inside the fee; it is billed straight to Google and Meta, so what you pay the platforms stays visible to you.
The full breakdown, including what moves an agent between tiers, is on our pricing page. If the landing page is the constraint rather than the ad account, that is a smaller and faster project — see insurance landing pages. And if you would rather talk it through against your own numbers before committing to either channel, get in touch.
The takeaway
Facebook vs Google is not a fight; it is a division of labor. Google captures the people already raising their hand — and the published benchmarks say insurance searchers click at 9.83%, well above the 6.64% all-industry average, then stall at a 2.64% conversion rate. Facebook creates hands to raise, cheaper per lead and colder per lead, with a 0.98% click-through rate on the traffic side that tells you exactly how much work the creative has to do. Match the motion to your line, size each test against the platform’s own documented floor, judge both by cost per sold policy in one system of record, and — once you can afford it — stop choosing and start running the pair that keeps your pipeline full in both directions.
- How to Run Facebook Ads for Insurance Agents (Step by Step)
A step-by-step guide to how to run Facebook ads for insurance agents: Special Ad Category setup, creative that converts, lead forms, and TCPA-safe compliance.
- How to Set Up Google Ads for Insurance Agents: Step by Step
How to set up Google Ads for insurance agents: campaign structure, settings, bidding, keyword and LSA setup, TCPA-aware compliance, and conversion tracking.
- Social Media for Final Expense Agents: Organic, Paid, and Compliant
Social media for final expense agents: which platform the 65-plus buyer uses, what Meta's Special Ad Category removes, and the TCPA and FTC posting rules.
- The Final Expense Sales Funnel: From Click to Issued Policy
A practitioner's map of the final expense sales funnel from click to issued policy: a stage table, checkpoints, and the math that decides the profit.