Home Insurance Marketing Budget: What to Spend, Where, and What It Should Return
A home insurance marketing budget works when every line item is priced against a bound policy, not a click: fund the quote page and follow-up first, then split the rest between local search and paid, and set a test budget of $500 to $1,500 per channel before you scale whichever one binds policies cheapest.
Most home insurance agents treat marketing like buying lottery tickets: spend on a channel, hope something binds, repeat. That works until the month it doesn’t. This playbook is the operator’s version, the same conversion systems and ad discipline we run for our senior-market clients, applied to the homeowners line. We sell marketing services, not policies, so what you get here is a way to think clearly about where your money goes.
A note on our credentials: we run a live lead operation in the final-expense and senior market — our own campaigns, not theory. Home insurance isn’t final expense, so we won’t pretend our exact numbers transfer. What does transfer is the discipline: track everything, fix the funnel before scaling traffic, and never run a channel you can’t measure.
What a home insurance marketing budget has to fund
It’s not a Facebook page and a logo. A budget that works funds a connected system with four jobs — and if you underfund any one of them, the money on the other three leaks. The strategy layer above the budget lives on our home insurance agent marketing hub; this page is the spending decision underneath it. The four jobs:
- Get found by homeowners actively shopping (search, referrals, ads)
- Capture the lead before they bounce (a fast, simple quote page)
- Follow up relentlessly — we build every sequence on the assumption that first contact does not bind
- Measure cost per bound policy so you know what to scale
Skip any one and the others leak. An agent with great ads and a slow inbox loses to a mediocre agent who calls back in two minutes.
How much should you actually spend? Three ways to set the number
Search this question and you get a percentage. WebFX’s insurance marketing budget guide says insurance companies “should plan to spend an average of 7-8% of their revenue on marketing,” and puts insurance agents at 3-8% of their revenue — a higher band than insurance companies overall, on its reasoning that agents are chasing more growth. Agents Alliance frames the same question more conservatively: “For many businesses, the marketing budget is between 3 to 5 percent of the business’s total income,” and cites survey data where “the mean was 8 percent and the median was 5 percent.”
Those bands are a sanity check, not a plan. A percentage tells you the size of the pot and nothing about whether the pot is being spent on anything that binds a policy. An agency spending 8% of revenue on a sponsorship banner and a stale website is inside the benchmark and still going nowhere.
Three methods produce a starting number, and they fail in different places — pick the one whose failure mode you can live with.
| Method | How you set the number | Where it breaks |
|---|---|---|
| Percentage of revenue | Take 3-8% of commission revenue and call that the annual pot | Says nothing about channel mix, and rewards last year’s revenue instead of this year’s goal |
| Backwards from a policy goal | Decide how many new households you want, multiply by a target cost per bound policy | Requires a close rate you may not be tracking yet |
| Fixed channel test | $500-$1,500 per channel per month until one proves out, then concentrate | Slow, and nothing gets scale until a winner appears |
For an agency with no clean historical numbers, the third method is the honest starting point, because it buys you the data the other two assume you already have. Run it for a quarter, then switch to the goal-backwards method once your close rate is measured rather than guessed. The same logic applied across every line of business is in our insurance agency marketing budget breakdown.
What a bound homeowners policy is worth to you
Every budget decision on this page is downstream of one number: what a bound homeowners household is worth over its life with you. Nobody can hand you that figure, but you can build it in ten minutes from things you already know.
Start with premium. The Insurance Information Institute’s homeowners fact file, using NAIC data, puts the average U.S. homeowners insurance premium at $1,411 in 2021, the latest year in that series, drawn from a December 2023 NAIC study of HO-3 owner-occupied package policies. That is up 7.6 percent from 2020, and up from $1,034 in 2012, where the series begins. Use it as a reference point only. Your own book’s average premium is the number that belongs in the math, and in a coastal or wildfire-exposed territory it will not resemble the national figure.
Then apply your commission rate. That rate lives in your carrier contract and varies by carrier, state and whether the policy is new or renewal, so we are not going to guess it for you — pull it from your own agreement. Multiply premium by rate to get first-year commission, then multiply by the number of years an average household stays with you to get lifetime value. That last multiplier is where most of the value sits, because a homeowners policy renews annually and the acquisition cost is paid once.
The output is a ceiling, not a target. If a bound household is worth several times a first-year commission, you can rationally pay more to acquire one than a single commission would justify — but only if you can prove the household actually stays. That proof is a retention system, which is why the retention half of the budget is a line item on this page and not an afterthought.
The channel scorecard
Here’s how the main channels compare for a typical independent home insurance agent — treat the figures as directional starting points to test, not gospel.
| Channel | Speed to results | Relative cost/lead | Lead intent | Best for |
|---|---|---|---|---|
| Local SEO + Google Business Profile | Slow (2-5 mo) | Lowest over time | High | Agents who’ll commit to 6+ months |
| Paid search (Google PPC) | Fast (days) | Higher | Highest | Agents with budget and a tight funnel |
| Referral system | Medium | Near zero | Highest | Every agent with a client book |
| Social / Facebook ads | Fast | Medium | Lower (interrupt) | Brand + bundling offers |
| Bought leads / live transfers | Instant | Per-lead fixed | Mixed (shared) | Filling capacity fast |
Shared leads are sold to more than one agent by design — that is what makes them cheaper than exclusive ones. That’s why purchased volume needs a faster follow-up than organic leads: you’re racing other agents to the phone.
Start with the funnel, not the traffic
The most expensive mistake we see is pouring budget into ads that feed a broken path. Before you spend another dollar on traffic, audit the route from click to bound policy. A clean homeowners quote page does three things: loads fast, asks for the minimum to start a quote, and sets the expectation of a callback. If your form has twelve fields, you’re paying for clicks and discarding half of them.
This is where most of the ROI hides. Doubling your conversion rate from 4% to 8% halves your effective cost per lead without touching your ad spend. Our insurance landing page builds exist for exactly this reason, and the same logic drives our conversion-focused web design for agents. If you want to see what the finished article looks like before you commission one, the home insurance agent website page walks through the structure.
Then there’s speed. We treat lead response time as the first thing to fix in any home insurance funnel — before ad copy, before targeting, before budget — because it costs no media dollars and it lifts the yield of every channel behind it. An automated first-touch (text + email) the instant a lead submits buys you time to call. That’s what email and follow-up automation for agents is built to handle, and the day-by-day sequence behind it is in our insurance lead follow-up cadence.
Local SEO: the compounding asset
Paid traffic stops the day you stop paying. Search rankings keep working. For home insurance, the searches that matter are local and specific: “homeowners insurance [your city],” “home insurance quote near me,” “[city] flood insurance agent.” Winning them comes down to:
- A fully optimized Google Business Profile with real reviews, correct categories, and posts
- A city-specific quote page that targets your service area (not a generic homepage)
- Plain-answer content to the questions homeowners actually type — coverage limits, wind vs. flood, dwelling-coverage math
This last point is also your GEO play (Generative Engine Optimization). AI search tools like ChatGPT and Google’s AI overviews pull from clearly structured, answer-first pages. An agent who publishes a clean table on “what homeowners insurance covers” gets cited; an agent with a wall of sales copy doesn’t. Our SEO for home insurance agents work targets both classic rankings and AI citation, and the broader insurance AI-search and GEO service covers the network-wide approach. The review half of the same job — volume, freshness, and the ask that produces them — runs through local SEO for insurance agencies.
What paid search costs when you’re selling home insurance
Paid search is the line item agents most often budget wrong, because the click price looks reasonable and the lead price doesn’t. LocaliQ and WordStream’s 2026 Search Advertising Benchmarks, compiled from Google Ads and Microsoft Ads campaigns and last updated 1 June 2026, put the blended Finance & Insurance category at figures worth reading side by side with the all-industry average.
The clicks are cheaper than average and the leads are not — that inversion is the whole budgeting problem in this channel.
| Metric | Finance & Insurance | All industries |
|---|---|---|
| Average cost per click | $3.39 | $5.42 |
| Average click-through rate | 9.83% | 6.64% |
| Average conversion rate | 2.64% | 8.18% |
| Average cost per lead | $74.44 | $66.69 |
Source: LocaliQ, 2026 Search Advertising Benchmarks, data last updated 1 June 2026.
Read the middle two rows together. Finance and insurance ads earn a click-through rate well above the all-industry average and then convert at 2.64%, far below the 8.18% average — so a category with cheap clicks still lands at a cost per lead above the all-industry figure. Every dollar of that gap is created after the click, on your landing page and in your follow-up. That is the arithmetic case for fixing the funnel first, and it is why we would rather spend an agent’s first month on the quote path than on keyword expansion. Line-level detail on where homeowners terms sit against auto, Medicare and final expense is in insurance PPC cost per click by line; the managed version of the channel is our insurance PPC service.
Budget the rate environment, not just the channels
A homeowners marketing budget written as if premiums were flat is a budget written for a market that no longer exists. Based on approved filings through 27 December 2024, S&P Global Market Intelligence’s RateWatch data shows the national calculated weighted average effective rate increase for homeowners insurance was 10.4% in 2024, following a 12.7% rise the previous year. In total, 33 states had double-digit calculated effective rate increases in 2024, with the largest in Nebraska at 22.7%; Montana, Iowa, Minnesota, Utah and Washington also saw premiums rise by more than 20%.
Those filings land on your book as renewal notices. JD Power’s 2025 U.S. Home Insurance Study, based on responses from 14,511 homeowners and renters interviewed between July 2024 and May 2025, found that 47% of U.S. homeowners insurance customers had experienced a premium increase in the past year — 49% among high lifetime-value customers, whom the study defines as those with higher annual premiums and a higher proportion of product and service needs purchased with one insurance carrier.
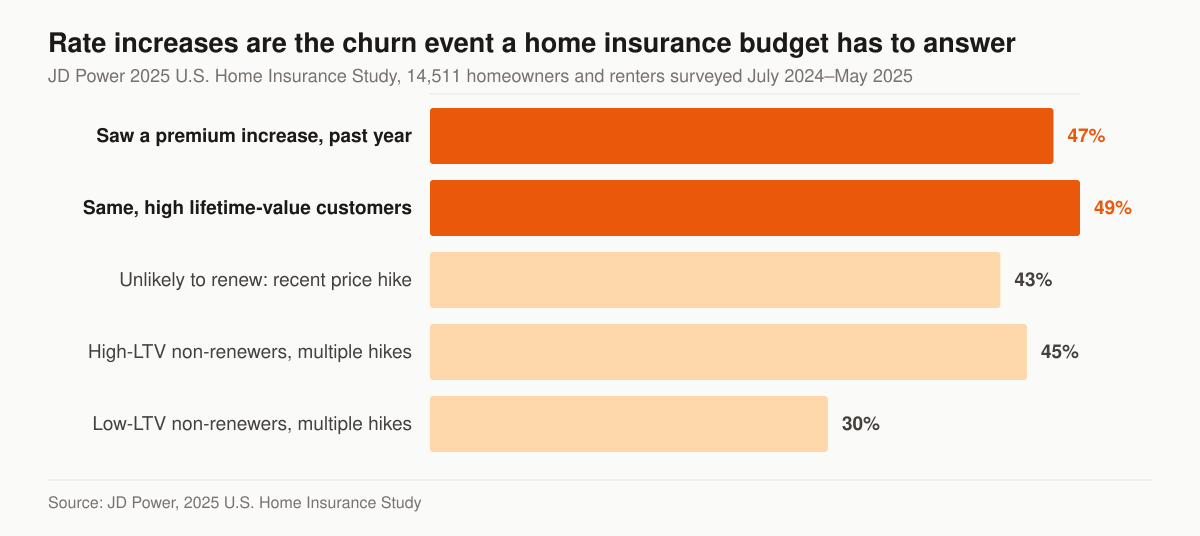
Rate increases and the churn they produce. Source: JD Power, 2025 U.S. Home Insurance Study, released 16 September 2025.
The churn side of the same study is the budget argument. Among homeowners customers who experienced a premium increase and say they are unlikely to renew, 43% cite the recent price hike as the reason for switching. Among customers unlikely to renew, 45% of high lifetime-value customers say they will not renew due to multiple price increases over time, against 30% of low lifetime-value customers — the profitable households are the ones most likely to leave over repeated increases.
The study also found the increase is survivable when it is explained. Among customers who experience a rate increase but fully understand the reason and are offered options, overall satisfaction averages 721 on a 1,000-point scale — 33 points higher than the average among those who experience no premium increase at all. “While these increases often reflect real cost pressures, they’re also eroding trust and driving customers to shop for alternatives,” said Craig Martin, executive director, global insurance intelligence at JD Power, in the study release.
So budget the conversation. A pre-renewal call on every account taking a material increase, with an explanation and a re-shop offer, is a marketing line item with a measurable return — retained households — and it competes for money against your ad spend on equal terms. The systematized version is our client retention program.
Referrals and bundling: the leads that cost you no media spend
Every bound homeowner is a referral source and a cross-sell. Two systems that tend to run on vibes instead of process:
- Referral ask: a specific script at the moment of binding (“Who do you know closing on a house this year?”), not a vague “tell your friends.”
- Bundling: home + auto is the natural cross-sell. A homeowner who bundles is stickier and cheaper to retain. If auto is a growth line for you, the auto insurance agent marketing playbook pairs directly with this one. The full system for turning monoline clients into multiline households is in cross-selling and account rounding for P&C agencies.
The auto-shopper gap that decides your bundling budget
There is a specific, measured gap in this market that a home insurance budget can be pointed at. JD Power’s 2026 U.S. Insurance Shopping Study, based on responses from 12,437 customers who requested an auto quote in the previous six months and fielded from January 2025 through January 2026, found that among recent customers actively shopping for an auto policy, 45% say they have a homeowners policy, but only 20% received a homeowners quote while shopping for auto insurance.
Stephen Crewdson, managing director, insurance intelligence at JD Power, framed the mechanism in the same release: “Most customers are only shopping their auto policy, and if the auto quote isn’t competitive, they don’t stick around to discuss home, life or other financial products. In practice, if an insurer can’t be competitive on auto, the door usually closes on any chance to bundle additional policies.”
Read that as an instruction for where a home agent’s cross-sell dollars go. The homeowners quote does not get requested on its own during an auto shop — it has to be offered, and it has to be offered while the auto conversation is still open. Budget for the offer: a standing script at auto quote, a monoline flag in the CRM, and a small recurring outreach to auto-only households in your book. None of that is media spend. It is process, tooling and someone’s time, so it is the one new-policy line in the plan that carries no media cost.
The same study also found customers now receive an average of 3.5 quotes, the highest level in the study’s history, and that 48% of new auto policies are purchased digitally, up from 36% five years earlier. More quotes per shopper means your quote has to arrive faster and read more clearly than it did five years ago, which pushes budget back toward the quote page and the follow-up rather than toward more impressions.
Should you buy leads or generate them?
Generating your own leads builds an asset you own; buying leads gives you instant volume on shared lists. Most growing agencies do both. The rule: never buy volume you can’t follow up on. If you do want to buy home insurance leads or live transfers as a product, get them direct rather than through resold middlemen — you can buy leads direct from getinsureleads and keep your acquisition cost transparent. Everything on this page is about the marketing system that makes those leads (bought or earned) actually convert.
One structural point worth holding while you choose. The Big “I” 2025 Market Share Report puts the independent agency channel at 61.5% of all P&C insurance written in the U.S., including 87.2% of commercial lines written premiums but 39% of personal lines, in a market whose direct written premiums reached $1.05 trillion in 2024. Homeowners sits in that personal-lines minority, which means your competition for a household includes carriers running national brand budgets. You will not outspend them. You can be the specific, local, fast answer in your own zip codes, which is what every dollar in this budget is buying.
Measure cost per bound policy, not cost per lead
Cost per lead is a vanity number. A $40 lead that binds beats a $9 lead that ghosts. Track the full chain in your CRM, and let the bolded row decide where next month’s money goes.
| Metric | Why it matters |
|---|---|
| Cost per lead | Channel efficiency, top of funnel |
| Lead-to-quote rate | Funnel and follow-up health |
| Quote-to-bind (close) rate | Sales process strength |
| Cost per bound policy | The number that decides where money goes |
| Policy lifetime value | What you can afford to spend to acquire |
When you know cost per bound policy by channel, budgeting stops being a guess. You move money toward what binds cheapest and cut what doesn’t.
Three starting budgets, and how we’d split them
These are our starting allocations, not an industry benchmark — nobody has measured what the average home insurance agent spends by channel, and any table claiming otherwise is guessing. What follows is where we would put a dollar on day one, for three common budget sizes, before any of the agency’s own data exists.
The pattern across all three: owned assets get funded first, paid spend is the last thing added and the first thing cut.
| Monthly budget | Owned assets (site, GBP, SEO, reviews) | Follow-up and automation | Paid channels | What we would leave out |
|---|---|---|---|---|
| Around $1,000 | The majority of it | A basic instant text/email reply | Nothing yet | Paid search, social ads, bought leads |
| Around $3,000 | Roughly half | Automation plus a nurture sequence | One channel, $500-$1,500 as a test | A second paid channel until the first is proven |
| Around $6,000 | Roughly a third | Full sequence plus CRM tracking by source | Two channels, tracked to bound policies | Brand spend with no attribution path |
Two rules make the table work. First, the website build is a separate capital line, not a monthly one — it is a one-time cost that every later channel routes through, and pretending otherwise starves the channels. Second, ad spend is a media cost, not a management cost; keep them on separate lines so you can tell an underperforming channel from an underfunded one.
What to cut first when the budget shrinks
Budgets get cut. The order in which you cut decides whether the book keeps growing after the money comes back.
- Cut brand spend with no attribution path first. Sponsorships, print, giveaways, anything you cannot trace to a bound policy. It may be doing something. You cannot prove it, and unprovable spend goes first.
- Cut the second paid channel before the first. Two half-funded paid channels produce less than one funded one, because neither accumulates enough conversion data to optimize.
- Cut paid before owned. Rankings, reviews and a working quote page keep producing after the spend stops. Ads do not.
- Cut top-of-funnel before retention. A household you lose costs a full acquisition to replace, and the rate-increase call defends revenue you have already paid for.
- Never cut follow-up. It is the only line where cutting reduces the yield of everything you kept.
Cut in that order and a lean quarter costs you growth rate rather than the asset base. Cut in reverse and you end the quarter with the same ad spend and nothing to spend it on.
What a managed program costs, and what it replaces
If you are pricing an agency against doing it yourself, here are our numbers rather than a range we made up. Our managed programs run at three published tiers, on the pricing page: Foundation at $2,500/mo covers the optimized site and landing pages, local SEO and Google Business Profile, on-page SEO and monthly reporting. Growth at $3,500/mo adds the ongoing SEO and content engine, AI-search visibility, and reputation and reviews. Full-Funnel at $5,500/mo adds managed paid ads, landing-page CRO, and marketing automation and CRM. A one-time website build runs $2,500–$8,000 depending on scope, and ad spend is billed separately, straight to the platforms.
Set those against the alternative honestly. The in-house version is a salary or a fraction of one, plus a tool stack, plus the owner hours that go into managing both — and the failure mode is not cost, it is that the work stops the first busy month. The agency version’s failure mode is paying for activity that never reaches a bound policy, which is why every tier above ships with reporting you can read against cost per bound policy rather than impressions.
Neither is automatically right for a given agency. The strategy layer that sits above the choice — channel order, personal versus commercial lines, the hard-market plays — is in our P&C insurance marketing strategy guide, and the review-generation piece specifically is covered in how to get more Google reviews as an insurance agent.
The monthly review that keeps the budget honest
A budget is a plan until someone reads the results against it. Put an hour on the calendar every month and answer five questions in order, using the chain from the metrics table above.
- What did each channel cost, and what did each bind? Not leads. Bound policies, by source tag.
- Where did the biggest drop happen? Lead-to-quote and quote-to-bind localize the leak to marketing or to sales, and they call for different fixes.
- Which renewals are inside the next 60 days, and which of them carry an increase? That list is next month’s retention work.
- How many auto-only households did we quote for home, and how many bound? The gap the shopping study describes shows up here or nowhere.
- What are we cutting? A budget with no kill decision in it is a budget that only grows.
Run that review four times and you have a channel mix built on your own data instead of somebody’s benchmark table — including this one.
Your 90-day starting plan
- Weeks 1-2: Fix the quote page and turn on instant text/email follow-up.
- Weeks 3-4: Optimize Google Business Profile, launch one city quote page, install a referral script.
- Weeks 5-8: Start one paid channel small ($500-$1,500/mo), tag every lead to its source.
- Weeks 9-12: Read cost per bound policy by channel, double down on the winner.
A home insurance marketing budget isn’t about finding a secret channel. It’s about funding a tight, measured system while your competitors guess. If you want a second set of eyes on where your pipeline leaks, our home insurance agent marketing program lays out the full silo, and you can get a free, no-pitch teardown through our free marketing audit. Bring your own numbers and we’ll read them against the tables above — or just get in touch and tell us which line item you’re least sure about.
- How Auto Insurance Agents Win Clients Online
How auto insurance agents get clients online: the three channels that produce quotes, the cost-per-bound-policy math, and the speed-to-lead rule behind it.
- P&C Insurance Marketing: A Channel-by-Channel Strategy Guide
P&C insurance marketing across 6 channels: referral partners, local SEO, reviews, retention, cross-sell, paid search — plus real costs and a 90-day plan.
- How to Run Facebook Ads for Auto Insurance Agents
A step-by-step guide to Facebook ads for auto insurance agents: audience setup, offers that beat rate-shoppers, ad structure, and the math behind scaling.
- Shared vs Exclusive Auto Insurance Leads: A Cost-Per-Policy Breakdown
Shared vs exclusive auto insurance leads compared on cost per sold policy, contact and bind rates, and where each wins — so P&C agents pick what actually pays.