Final Expense Commission Levels for Agents: What Your Contract Actually Pays
Final expense commission levels for agents are the percentage of annualized first-year premium your contract pays. On one IMO's published 2026 new-agent grid, the first-year rate runs from 60% to 130% depending on which carrier and product you write, so the level you hold changes your real cost per sale.
Final expense commission levels for agents decide how much of each sale you actually keep. They sound simple — a percentage of premium — but the number you hold, where it sits in your IMO hierarchy, and how it interacts with lead cost and chargebacks is where a book either compounds or quietly bleeds money.
This is a marketing-economics view of contract levels, written for agents and agency owners. We sell marketing, not insurance contracts, so treat carrier-specific numbers as something to verify with your upline. What we can show you is how the math connects to lead spend.
How final expense commission levels actually work
A commission level is the percentage of annualized first-year premium a carrier pays you on a final expense policy. Write a policy with a $50/month premium and you have $600 in annualized premium. At a 100% level, your first-year commission on that policy is roughly $600, paid out either as earned or as an upfront advance (advance terms are set per carrier — see the advance section below).
“Contract level” and “commission level” describe the same thing from two angles:
- Contract level is your position in the IMO or carrier hierarchy.
- Commission level is the percentage that position pays.
- The spread between your level and the levels above you becomes the override that flows to your upline and the IMO.
So when an IMO offers you “a higher contract,” they mean a higher commission percentage and a smaller override taken above you. That is the lever every recruiting conversation circles around.
Typical final expense contract levels and what the ranges mean
Ranges vary by carrier, production history, and whether you are captive or independent, so treat the table below as a rough map and confirm your own numbers in writing.
| Tier | Approx. level (annualized FYP) | Who usually holds it |
|---|---|---|
| Entry / captive | ~80%–100% | New agents, lead-subsidized programs |
| Street level | ~100%–115% | Independent producers |
| Higher / agency | ~115%–130%+ | Experienced producers, agency owners |
Two notes that matter more than the table:
- Lead-subsidized contracts pay less for a reason. A captive shop that “gives” you cheap or free leads usually does it by holding you at a lower level and keeping the spread. The “free” lead is priced into your commission.
- A “release” lets you move your contract to a new IMO without sitting out a waiting period. Ask about release terms before you sign — it affects how trapped you are if the lead flow disappoints. Release terms are one of eight things to settle before contracting; the full checklist is in our guide to choosing an FMO.
If you are weighing where to start, the trade-off between cheap leads and higher commission is one we break down in our guide to final expense marketing and in the deeper look at the true cost per sale of final expense leads.
What a published final expense commission grid actually looks like
Bands like the one above are how the market talks. A grid is how the market pays. FEX Contracting publishes the new-agent grid it starts every direct agent on, and reading it changes the question you ask an upline.
The January 2026 edition lists 28 carrier and product rows. On that single starting contract, the first-year rate is 60 on the Christian Fidelity Assurance row, 80 on Catholic Financial, 90 on the Aetna Protection Series, 100 on Lafayette Heritage, 115 on Illinois Mutual, 120 on Mutual of Omaha’s Living Promise, 125 on Bankers Fidelity and 130 on the Transamerica Express row (FEX Contracting, 2026 new agent commission grids). Same agent, same day, same upline: 60 at one end of the page and 130 at the other.
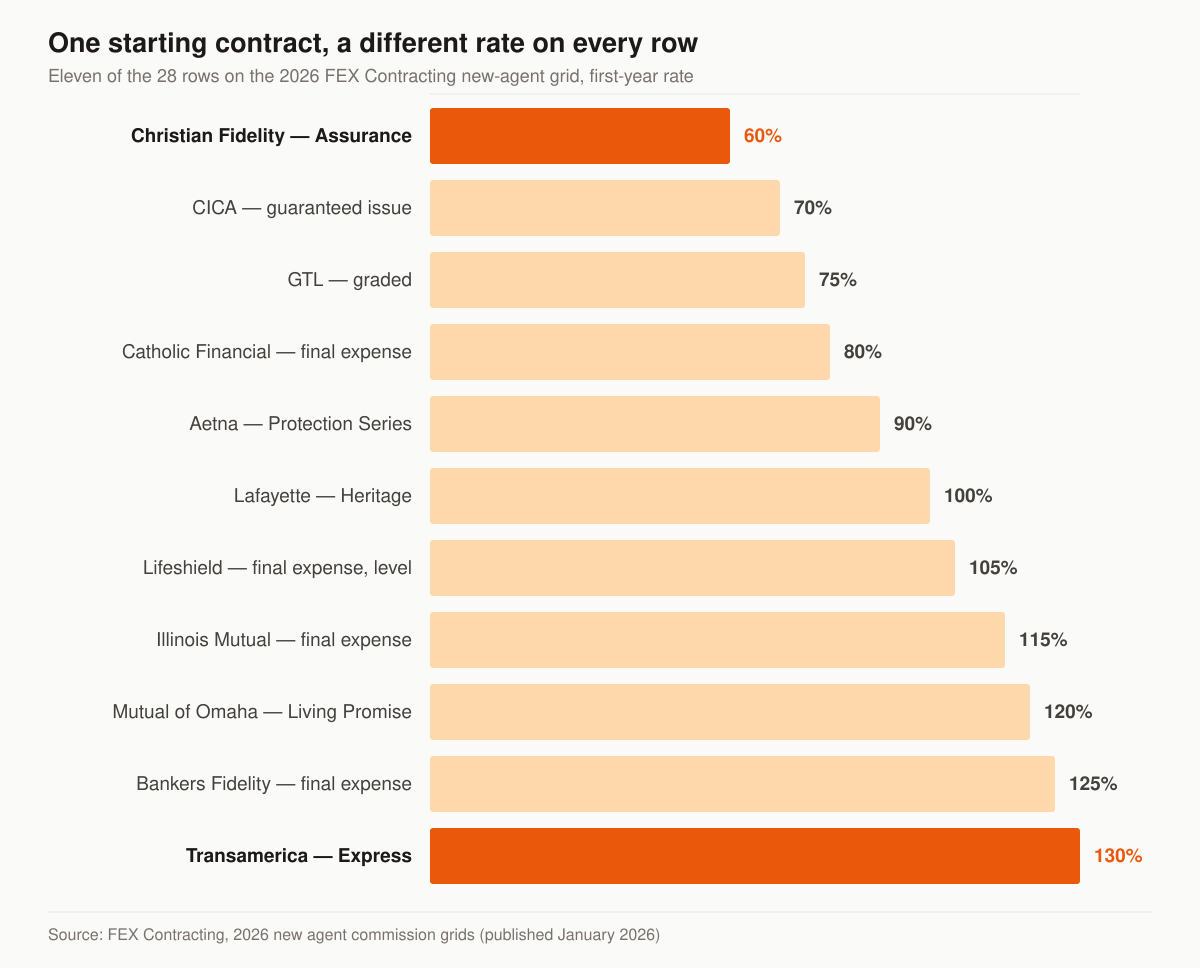
Eleven rows from one published 2026 new-agent grid. Source: FEX Contracting, 2026 new agent commission grids, published January 2026.
That is why “what level are you at?” has no single answer. The FEX Contracting page that hosts that grid puts it plainly: “Street level at one agency can be 70% and 100% on the exact same product at a different agency.” (FEX Contracting, final expense commission levels) Your level is a grid. Ask for the grid.
Which product a case lands on moves the rate as much as which carrier does: the four rows the grid groups under a guaranteed issue header sit at 60, 70, 75 and 80 in year one — the bottom of the page — while rows above that block reach 130.
| Row on the 2026 grid | Product / level as printed | Year 1 as printed |
|---|---|---|
| Gerber | Guarantee issue | 60 |
| Christian Fidelity | Assurance | 60 |
| CICA | Guarantee issue | 70 |
| GTL (near GI) Graded | Graded ROP/50%/100% | 75 |
| AIG | Guarantee issue | 80 |
| Trinity / Family Benefit | Golden Eagle (Plus 5% lead credit) | 105 |
| Foresters | PlanRight | 120 |
| Transamerica | Express / Immediate Solutions | 130/115 |
The grid annotates the guaranteed issue block — the AIG, CICA, Gerber and GTL rows below that header, not the Golden Eagle row above it — as “Used as last resort for uninsurable applicants,” and its own footnote sets the caveat on all of them: “Graded/modified benefit policies or policies on certain ages may pay less with some companies. All information is subject to change without notice.”
There is a marketing consequence buried in that table. Your blended commission is set by your carrier mix, and your carrier mix is set by the health profile of the people your marketing puts in front of you. A lead source that reliably delivers impaired-risk prospects pushes you down toward the guaranteed-issue rows and lowers your average rate without anyone renegotiating anything. That is one reason we treat guaranteed issue marketing as a separate campaign with its own economics rather than an overflow bucket, and why the carriers you can actually write belong in the contracting conversation, not after it.
Renewals: the column that can outrank the first-year level
Recruiting conversations happen in the first-year column. The renewal columns on the same grid vary more, and they run for years after the sale.
Two rows on the 2026 grid make the point: the one with the lower first-year rate carries the richer renewal stream, and nothing in a “we pay street plus” pitch would tell you that.
| Row on the 2026 grid | Year 1 | Years 2–5 | Years 6–10 | Years 11+ |
|---|---|---|---|---|
| Aetna ACI-CLI — Protection Series | 90 | 14.75 | 14.75 | 3.5 |
| Americo — Eagle Select | 115 | 1 | 1 | 0 |
| Illinois Mutual — final expense | 115 | 4 | 4 | 4 |
| Mutual of Omaha — Living Promise | 120 | 5.5 | 3.5 | 0 |
| Transamerica — Express | 130 | 3.25 | 2.25 | 0.5 |
Read the Aetna and Americo rows side by side. Both pay a renewal in each of years two through ten. One pays 14.75% of premium in every one of those years and the other pays 1%. The Illinois Mutual row keeps paying 4% past year eleven; three of the five rows above drop to zero or near it. Run your own totals on your own premium mix — the point is that a first-year comparison answers a fraction of the question.
For a marketing budget, renewals are the line that funds acquisition without a new sale. A book with a real renewal stream lets you hold lead spend flat through a slow month instead of cutting the thing that produces next month’s slow month. That is the argument for retention work being a growth activity, which is how we frame it in the final expense sales funnel.
Issue age and product type move your rate without changing your contract
A carrier’s own compensation schedule can pay several different first-year rates under one contract, and none of them involve renegotiating your level.
The United of Omaha final expense Compensation/Product Schedule (form UN0096_0120, first approved 1 January 2020) sets the level product at a first-year rate of 90.0% for issue ages 45 to 75, 85.0% for issue ages 76 to 80, and 45.0% for issue ages 81 to 85. The graded product pays 65.0% for issue ages 45 to 80. Renewals run 4.5% in years two through ten on the level product and 0.0% on the graded product; both pay 0.0% from year eleven (United of Omaha, final expense compensation schedule).
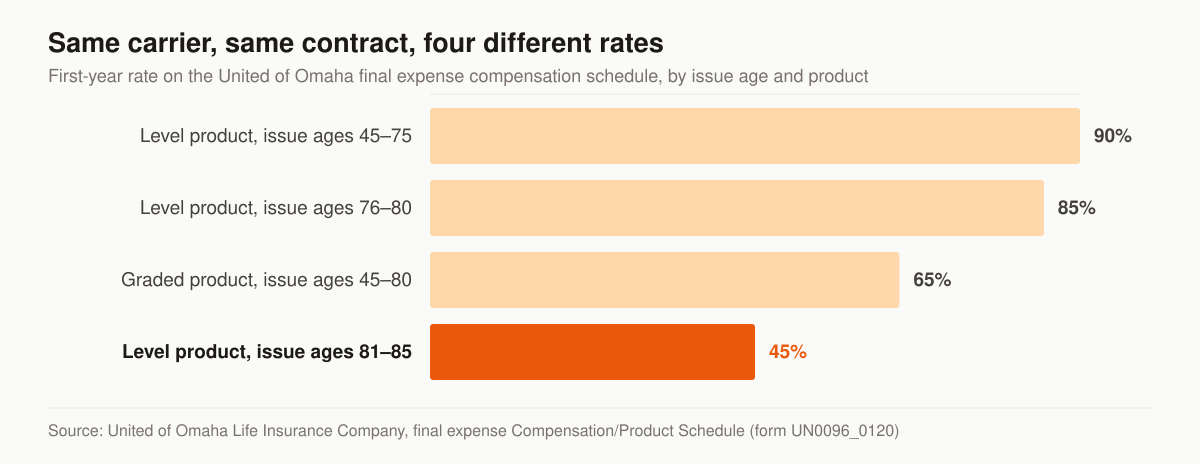
Four rates on one carrier schedule, separated only by issue age and product. Source: United of Omaha Life Insurance Company, final expense Compensation/Product Schedule, form UN0096_0120.
Two scope notes before you use those numbers for anything. First, this is a marketer schedule, which means it is a ceiling for the hierarchy rather than a writing agent’s take: the same document states that “Your rate for each policy will be reduced by any rates the Company has assigned to other persons in your down line distribution for such policy, if any,” and that “In no event shall the rate credited to you and your down line distribution for each policy exceed the rate provided on this Schedule.” Second, it covers a specific product on a specific contract. It is a different document from the Living Promise row on the FEX grid above, and the two are not comparable line for line.
The mechanic underneath is worth knowing regardless of carrier. The same schedule specifies that “Commission is calculated on paid premium including policy fee.” Your commissionable base is premium the carrier actually collected, policy fee included — not face amount, and not premium that was billed and never paid.
Now the marketing consequence, which is the part no recruiting deck puts in front of you. On that schedule the level product’s first-year rate is 90.0% for a 70-year-old applicant and 45.0% for an 82-year-old — same product, same page, nothing renegotiated. A direct-mail drop, a Facebook audience or a call list weighted toward the oldest end of the market is not the same business as one weighted toward newly retired buyers, and the difference shows up in revenue per sale before it shows up anywhere else. That is a commission decision dressed as a targeting decision, and it is why we build senior market campaigns around a defined age band instead of “seniors.”
Why the headline percentage is not your real number
Gross commission is not take-home. Three things eat into it:
- Chargebacks. If a policy lapses inside the advance period, you repay the unearned portion. Poor lead quality and weak follow-up drive chargebacks up.
- Persistency. Carriers track how much of your book stays on the books. Low persistency can cap your contract level or your renewals.
- Lead cost. The variable an agent controls most directly. A high level on expensive, badly worked leads loses to a moderate level on a tight system.
That last point is the whole game. Take an agent running an illustrative $8 cost per lead who closes roughly one in six: six leads at $8 is under $50 in acquisition cost per sale. Against ~$600 of annualized premium, the lead spend is small — but only because the close rate holds. Double the lead cost or halve the close rate and the picture flips fast.
Advances are cash flow, not commission
An advance does not raise your commission. It moves it forward. The carrier pays part of the first-year commission before it has collected the premium behind it, on the expectation that the premium arrives. Redbird Advisors describes the common structure this way in its published guide: “Most carriers advance commissions, meaning they pay six to nine months of commissions upfront instead of waiting for monthly payments,” with as-earned as the alternative that pays monthly as the client pays (Redbird Agents, average final expense commission).
Three consequences follow, and they are all budget consequences rather than income ones.
The first is that an advance and a level are independent variables. A 120 contract paid as-earned and a 100 contract advanced nine months produce very different bank balances in month one and very similar ones in year two. Agents comparing two offers routinely compare the wrong pair of numbers.
The second is the debit balance. When a policy stops paying inside the advance window, the unearned portion comes back — not as a bill, usually, but as a negative balance the carrier nets out of your next statements. An agent whose lead budget was set from advance receipts discovers this in the month the advances slow down, which is also the month the chargebacks land.
The third is the one that matters for planning: set your marketing budget from earned commission and a chargeback reserve, not from the deposit. The true cost per sale of final expense leads is the number to run that budget against, because it is the one that survives the advance period.
Persistency: what published lapse data says about your chargeback reserve
Nobody can hand you your own persistency rate but your carrier and your upline. What is public is the industry backdrop, and it is a reasonable floor to argue from.
The ACLI’s 2025 Life Insurers Fact Book reports that “The voluntary termination rate of individual life insurance policies reached 5.8 percent by 2024 (Table 7.4).” Counted by number of policies rather than by face amount, the same edition puts the individual life lapse rate at 6.6 percent in 2024 and 7.3 percent in 2023, with a combined lapse-and-surrender termination rate of 7.9 percent in 2024 and 8.5 percent in 2023 (Table 7.5) (ACLI 2025 Life Insurers Fact Book, chapter 7).
Read those with their scope attached. They cover all individual life insurance across every product and every issue year, not final expense specifically, and they measure terminations against policies in force during the year rather than first-year persistency on newly written business. They are context, not your reserve.
The same chapter carries a fact that explains why final expense economics feel different from the rest of the life business. In 2024, whole life and endowment policies accounted for 60.7 percent of individual life policies purchased in the United States but 27.9 percent of the face amount purchased (Table 7.2). The product family final expense lives in is a high-count, small-face business. That is the structural reason cost per sale, not cost per lead, is the metric that decides whether a final expense operation works — a small revenue per policy leaves very little room between a good acquisition number and a bad one. It is also why speed of follow-up carries disproportionate weight here; the mechanics are in our lead follow-up cadence breakdown and in the field notes on selling final expense over the phone.
The math: tying commission level to cost per sale
Here is the chain every agency owner should be able to run on the back of a napkin:
- Revenue per sale = annualized premium × your commission level.
- Allowable cost per sale = revenue per sale × the share you will spend to acquire it.
- Allowable cost per lead = allowable cost per sale ÷ leads per sale (your close rate inverted).
Worked example at a 100% level on a $600 premium policy — every figure below is illustrative arithmetic, not an observed result:
| Input | Value |
|---|---|
| Annualized first-year premium | $600 |
| Commission level | 100% |
| Gross commission per sale | ~$600 |
| Leads to make one sale (one-in-six) | 6 |
| Target: spend ≤ 15% of commission on leads | $90 per sale |
| Max profitable cost per lead | $15 |
Raise the contract level and the “$90 per sale” ceiling rises with it — you can now bid more for better, fresher leads and still protect margin. Lower the level, and cheap leads become mandatory just to break even. That is why commission level and lead strategy can never be decided separately.
The lever you control fastest is the close rate, not the contract. Tightening follow-up — speed-to-lead and a real cadence — moves leads-per-sale more than any percentage point of commission. We cover the mechanics in our lead follow-up cadence breakdown and the final expense sales funnel.
Turning your level into a monthly marketing budget
Run the same three-step chain across the range the published grid actually spans, and the commission level stops being a bragging right and becomes a bid ceiling.
The table below applies the identical arithmetic — a $600 annualized premium, a 15% lead allowance, one sale per six leads — across first-year rates that appear on the 2026 grid; the rates are published, everything else is an illustration you should replace with your own numbers.
| First-year rate | Gross per $600 policy | 15% lead allowance | Max cost per lead at 1-in-6 |
|---|---|---|---|
| 80% | $480 | $72 | $12.00 |
| 90% | $540 | $81 | $13.50 |
| 100% | $600 | $90 | $15.00 |
| 115% | $690 | $103.50 | $17.25 |
| 130% | $780 | $117 | $19.50 |
Two things fall out of that column of numbers.
The first is how narrow it is. Moving from an 80 contract to a 130 contract — the full width of the published grid — buys $7.50 of extra bid room per lead in this illustration. Real lead prices move across a wider range than that between vendors, lead ages and exclusivity terms, which is the comparison we lay out in exclusive versus shared final expense leads and in the pricing behaviour of aged final expense leads. Your sourcing decision has more leverage on this table than your contract negotiation does.
The second is what happens to the same table when the close rate moves. Halve it to one sale per twelve leads and every figure in the last column halves too, at every contract level. No commission level survives a broken follow-up process, which is the whole argument for treating acquisition as a system rather than a purchase — the reasoning behind how our lead generation programs are built, and behind the monthly figures on our pricing page, where the programs run from $2,500 to $5,500 a month. Put the retainer in the same equation as the leads: it is one acquisition cost, and it should be judged against cost per placed policy.
Vesting, replacement rules, and what the schedule says after you leave
The commission schedule is also the document that decides what you keep. Three clauses on the United of Omaha final expense schedule are worth reading before you assume anything about your book.
Vesting is conditional, and all three conditions apply at once: “Commission for the Product is vested and may be credited to you after the termination date if (a) the policy remains in force, (b) the premiums for the policy are credited to Company, and (c) you are the writing agent and you remain the producer of record.” Producer of record is the clause with teeth. It makes servicing your existing book a compensation activity, not a courtesy — if a client is moved to another agent of record, the vesting language stops paying you regardless of who originally wrote the policy.
Assignment is barred outright: “You may not assign or pledge as collateral any commission payable under this Schedule. Any attempt to assign commission under this Schedule shall be void.” Agents who plan to fund a marketing push by borrowing against expected renewals should read that sentence on their own carrier’s schedule before they build a budget on it.
And the schedule prices the replacement pitch. Under the same commission rules, conversions are restricted and discounted: “Conversions from the Term Life Express (TLE) product are not allowed in policy years 0 – 2. First year commission will be reduced by 50% when converting a TLE policy in years 3 – 5. First year commission will not be reduced when converting a TLE policy in years 6+.” Where a lead script leans on replacing existing coverage, check what your carrier’s schedule pays on a replacement before you build a campaign around one.
One more line is worth quoting because agents assume the opposite: “Commission payments payable, paid or provided to you pursuant to this Schedule are not confidential and may be required to be disclosed to customers and/or potential customers.”
What you may and may not pay out of your commission
Once you know your revenue per sale, the next question tends to be who you can share it with — a funeral director who sends you families, a church group, a barber, a partner who forwards names. This is regulated, it is regulated state by state, and the drafting is specific enough that summaries mislead.
Texas is a useful example because its text is plain. Under Texas Insurance Code section 4005.053(a), an insurer or agent engaged in the business of insurance in that state “may not pay to any person, directly or indirectly, and may not accept from any person a commission or other valuable consideration for a service performed by that person as an agent in this state unless the person holds a license to act as an agent in this state.” Subsection (c)(2) reaches referral arrangements specifically, barring an agent from giving an unlicensed person “a fee or other valuable consideration for referring a customer who seeks to purchase an insurance product or seeks an opinion on or advice regarding an insurance product, based on that customer’s purchase of insurance” (Tex. Ins. Code ch. 4005).
Note the scope limiter at the end of that clause — the prohibition attaches to consideration paid on the basis of the customer’s purchase. Note also the carve-out subsection (d) makes from subsection (c): it does not prohibit an agent, “in connection with an offer or sale of an insurance policy or contract,” from giving “an item that is a promotional advertising item, educational item, or traditional courtesy commonly extended to consumers and that is valued at $25 or less.” And subsection (b) carves an exception out of subsection (a) for agents who have left the business — it “does not prevent the payment of a renewal or other deferred commission to a person or the acceptance of a renewal or other deferred compensation by a person solely because the person no longer holds a license to act as an agent.”
That is Texas. Your state will have its own section, its own carve-out and its own dollar figure, and the differences are not cosmetic. The practical line to hold everywhere is the one the statute draws: buying marketing — a mailing, a lead, an ad, a list — is a purchase of services at a stated price, while paying someone per closed policy is compensation for producing insurance business. Price your marketing as marketing. We keep the wider set of these rules in one place in our insurance marketing compliance guide, and the same principle governs how final expense lead campaigns should be contracted.
How to use your commission level when planning marketing
- Know your real net per placed policy, after chargeback reserves — not the gross advance.
- Set a lead-cost ceiling from that number, not from what a vendor is charging this week.
- Buy fewer, better leads if your level supports it; exclusive and fresh leads can beat cheap shared lists once you account for close rate and chargebacks.
- Reinvest the override if you run an agency — your spread above producers is marketing capital, and the highest-leverage place to spend it is acquisition that producers can actually close. If you run an IMO or FMO and want to deploy that override at scale, our white-label marketing program for IMOs and FMOs runs the acquisition engine under your brand.
Higher commission does not fix a leaky funnel; it just makes the leak more expensive. A commission problem and a cost-per-sale problem look identical on a bank statement, and we check the second one first.
If you want a second set of eyes on the math, we will map your level, close rate, and lead cost into a single cost-per-sale figure in a free marketing audit — no pitch, just the numbers. You can also see how this plays out in a real book in our Texas final expense agency case study. Commission level is one lever; for the rest, see how to grow a final expense insurance agency.
Bottom line on final expense commission levels for agents
Your contract level sets revenue per sale; your marketing system sets how many sales you get per dollar spent. Optimize both, and in the right order — net economics first, headline percentage second. Get the contract you can defend, then build the lead and follow-up engine that makes that contract worth holding.
Four documents settle the question that a recruiting call cannot: the full commission grid carrier by carrier, the renewal columns beside the first-year column, the carrier’s own compensation schedule with its issue-age bands and product splits, and the release policy in writing. Ask for all four before you sign, and ask for them together — each one is only readable against the other three.
When you are ready to turn those numbers into a plan, start with our final expense marketing services and bring your own figures. The agents who win in this market are the ones who treat commission and acquisition cost as one equation, not two.
- How to Evaluate the Best Final Expense Carriers for Agents
How to evaluate the best final expense carriers for agents: underwriting niches, issue ages, graded wording, ratings and a scoring framework.
- Final Expense Telesales: How to Sell Final Expense by Phone, Call by Call
How to sell final expense insurance over the phone: a tested telesales process, rapport openers, a rebuttal table, draft-date timing, and the federal call rules.
- Final Expense Sales Tips That Actually Move Placed Policies
Final expense sales tips from a working book: lead routing, speed-to-dial, scripting, and the close mechanics that turn contacts into issued policies.
- Digital Marketing for Final Expense Agents: The Channels That Actually Produce
A practitioner's guide to digital marketing for final expense agents: which channels produce leads, what each costs, and how to sequence them by budget.