Insurance Agency Marketing Budget: What It Costs, and the Cost-Per-Sale Math Underneath
A workable insurance agency marketing budget runs 7–12% of gross revenue for a steady book and 15–20% when growing. On $300,000 of revenue that costs $1,750–$3,000 a month; outsourcing to an agency costs $2,500–$5,500 a month. The percentage sets the ceiling; cost-per-sale math decides whether the spend works.
Plenty of agents pick a marketing number out of the air. They spend $2,000 one month because cash was good, then cut to zero the next month because two deals fell through. That is not a budget. That is a mood.
A real insurance agency marketing budget does two things at once: it sets a ceiling tied to revenue so you never overspend, and it sets a floor tied to your cost-per-sale math so you never starve the channel that feeds you. This post covers both, with the tables to run the numbers yourself.
The benchmarks below come from running our own final-expense book, so they are read the way an operator reads them, not a vendor.
What percent of revenue should go to marketing?
The percentage method gives you a sane ceiling. You decide what share of gross revenue goes back into acquiring new business, and that caps your downside.
Here is the range we see hold up across senior-market agencies:
| Agency stage | Marketing as % of gross revenue | What it usually funds |
|---|---|---|
| Holding steady | 7–12% | Replace natural attrition, light lead flow |
| Growing | 15–20% | Aggressive lead buys, paid ads, hiring producers |
| New / launch (first 6–12 mo) | 20–30% | Buying a book from zero, no renewals yet |
| Coasting (not recommended) | under 5% | Slow decline as the book ages |
Percentages are hard to act on. Here is the same table in dollars — monthly marketing spend by annual gross revenue:
| Annual gross revenue | 7% (steady, low) | 12% (steady, high) | 15% (growing) | 20% (growing, high) | 30% (launch) |
|---|---|---|---|---|---|
| $150,000 | $875 | $1,500 | $1,875 | $2,500 | $3,750 |
| $300,000 | $1,750 | $3,000 | $3,750 | $5,000 | $7,500 |
| $500,000 | $2,917 | $5,000 | $6,250 | $8,333 | $12,500 |
| $750,000 | $4,375 | $7,500 | $9,375 | $12,500 | $18,750 |
| $1,000,000 | $5,833 | $10,000 | $12,500 | $16,667 | $25,000 |
| $2,000,000 | $11,667 | $20,000 | $25,000 | $33,333 | $50,000 |
Every cell is the annual revenue multiplied by the percentage, divided by twelve. Find your revenue row, pick the column that matches your stage, and that is your monthly ceiling.
Two notes that matter for senior-market agents specifically:
- Final expense skews toward the higher end early because the buyer pool is large but the policies are small, so you need volume to build income. See our deeper breakdown of final expense lead costs versus true cost per sale.
- Medicare is seasonal. Your annual percentage can look modest, but spend concentrates hard around AEP (Oct 15–Dec 7). Plan the calendar, not just the year. CMS rules govern what you can say and when, which is a separate constraint from budget — but it shapes how you deploy it.
Why every published benchmark disagrees
Search this question and you get numbers from 3% to 20%. They are not really in conflict — they are measuring different denominators. Here is what the sources actually say:
| Source | The figure | Denominator used | Date |
|---|---|---|---|
| American Agents Alliance | 3–5% | total income | Oct 2019 |
| Small Business Administration (via Jenesis Software) | 7–8% | gross revenue, under $5M sales, 10–12% net margin | Nov 2018 |
| PSM Brokerage | 3–8% | revenue | undated |
| Insurance Pro Agencies | 5–10% | gross commission revenue | May 2026 |
| The Insurance Dudes | 10–15% fast-growing, 2–5% typical | revenue | Apr 2025 |
| Insurance Advertising Masters | 10–20% year one, 5–10% years 2–3 | target income | undated |
The spread collapses once you fix the denominator. For an agency, gross commission revenue is revenue — you never budget against premium written, which is five to ten times larger and belongs to the carrier. Budget a percentage of the money that actually lands in your account, and the 3% and the 20% turn out to be the same agency at different stages.
The percentage is your guardrail. It is not the answer. An agency can spend exactly 12% of revenue and still lose money if the cost-per-sale math underneath is broken.
Then Back Into the Cost-Per-Lead Math
Percentages tell you how much. Cost per lead and cost per sale tell you whether it works. These are the numbers that actually decide profit.
Three terms, kept plain:
- Cost per lead (CPL) — total spend divided by leads produced.
- Close rate — sales divided by leads worked.
- Cost per sale (CPS) — CPL divided by close rate. This is the one that matters.
A lead price tells you almost nothing on its own. A $9 lead and an $18 lead can have identical economics if the $18 lead closes at twice the rate. Run the table:
| Lead type | Cost per lead | Close rate | Cost per sale | Avg. annual premium | Rough first-year commission |
|---|---|---|---|---|---|
| Shared FE lead | $9 | 1-in-10 | $90 | $600 | ~$480 |
| Exclusive FE lead | $28 | one-in-six | $168 | $600 | ~$480 |
| Aged FE lead | $1.50 | 1-in-25 | $37.50 | $600 | ~$480 |
| Live transfer | $45 | 1-in-4 | $180 | $600 | ~$480 |
The point of the table is not the exact figures — yours will differ. The point is the method: every dollar of spend should be judged by cost per sale against commission, never by the sticker price of the lead. We go deeper on this trade-off in exclusive versus shared final expense leads.
Notice that aged leads show the lowest cost per sale on paper. They also demand the most dials and the thickest skin, and the math only holds if you actually work the volume. Cheap leads that sit in a CRM are the most expensive leads you own.
How much can you afford to pay to acquire a client?
Cost per sale tells you what you paid. It does not tell you what you were allowed to pay. That ceiling comes from what a client is worth across the whole relationship, and it is a different calculation from the percentage-of-revenue ceiling at the top of this page — one is a limit on the agency, the other is a limit per client.
Insurance Pro Agencies publishes a per-client economics framework for independent property and casualty agencies, and it is a reasonable place to start if you have not built your own:
| Client type | Annual commission | Retention | 10-year lifetime value |
|---|---|---|---|
| Personal lines | $400–$600 | 93% | $3,000–$4,500 |
| Bundled | $800–$1,200 | 95% | $6,000–$9,000 |
| Commercial lines | $1,500–$5,000 | 94% | $10,000–$35,000 |
Figures published by Insurance Pro Agencies, May 2026. Their profitability test on the same page: “Any marketing spend that acquires a bundled personal lines client for under $500 or a commercial client for under $1,000 is profitable.”
Two things follow for a senior-market book. First, a per-client ceiling survives a bad month in a way a percentage does not. A percentage of revenue falls exactly when revenue falls — that is, at the moment you can least afford to stop acquiring. The lifetime value of a client you write in a bad month is unchanged.
Second, the shape of the commission matters as much as the size. A line that pays most of its money in year one funds its own acquisition almost immediately. A line that pays a thin first year and a long renewal stream is financed out of your cash reserve for a year before it pays anything back, so the same cost per sale carries a very different cash risk. Our breakdown of final expense commission levels sets out how those schedules differ by carrier and age band.
We set the affordable acquisition cost first and the percentage of revenue second. If cost per sale sits under the ceiling, the percentage only decides how fast you can go. If it sits above the ceiling, no percentage rescues the plan — growth just loses money faster.
A Simple Budget Formula
Once you know your cost per sale, you can budget forward instead of guessing. Work it in this order:
- Set a sales goal. Say you want 20 new policies this month.
- Use your real cost per sale. If it is $120, that is 20 × $120 = $2,400 in lead spend.
- Add the channel cost. Ads, CRM, dialer, landing pages — call it 25% on top. Now you are at ~$3,000.
- Check it against the ceiling. If $3,000 is more than 20% of your gross revenue, your goal is too aggressive for this month, or your cost per sale is too high to scale yet.
- Fix the weak number first. A broken close rate is cheaper to fix than it is to out-spend. We tighten follow-up before buying more leads.
That last step is where most budgets are saved or wasted. If your leads are fine but your close rate is soft, more spend just buys more leads you fail to close. Our guide to insurance lead follow-up cadence covers the single highest-leverage fix here, because speed-to-lead and contact attempts move close rate more than lead source does.
How should an insurance agency split its marketing budget?
A defensible budget is split across what produces today and what compounds tomorrow. A rough starting allocation:
| Bucket | Share of budget | Why |
|---|---|---|
| Direct lead generation | 55–65% | Pays back this month in policies written |
| Paid ads / channel costs | 15–25% | Feeds the lead engine, controllable, measurable |
| Website & owned assets | 10–15% | Compounds; lowers future cost per lead |
| Brand & content | 5–10% | Long-tail trust, referrals, AI search visibility |
What is the 70/20/10 rule for marketing budget?
The 70/20/10 rule splits spend by how proven each channel is: 70% into what already works, 20% into channels that show promise but are not yet dialled in, and 10% into genuinely experimental bets. It is a risk frame rather than a channel frame, and it stacks cleanly on the allocation table above — the 70% is your direct lead generation, the 20% is the paid and owned assets you are still tuning, and the 10% is where a new platform or offer gets tested at a size that cannot hurt you.
One seasonal caveat for Medicare agents: run the experimental 10% outside the October 15 – December 7 window. AEP is the worst possible time to learn something new, because every dollar is competing at its annual peak cost and a failed test costs you the selling season, not just the spend.
The mistake is putting 100% into bought leads. That keeps you renting your pipeline forever. A portion belongs in owned assets that lower your cost per lead over time — a fast, trustworthy site and content that earns inbound. If you want help sizing the engine that drives the first bucket, our insurance lead generation service is built around the same cost-per-sale math shown above.
What does each marketing channel cost per month?
Allocation percentages are unusable until you know what a channel costs to run properly. Published ranges are wide, and the width is the information: a $2,500 SEO line and a $7,500 SEO line are usually different scopes, not two prices for the same work.
Here is what published sources currently ask per channel, per month:
| Channel | Published monthly range | Published by |
|---|---|---|
| Email marketing and SMS | $50–$100 | WebFX |
| Content and scheduling tooling | $50–$200 | Insurance Pro Agencies |
| Paid advertising (Google, geofencing, programmatic) | $100–$10,000 | WebFX |
| Paid advertising, suggested starting test | $500–$1,000 | Insurance Pro Agencies |
| Social media | $100–$5,000 | WebFX |
| SEO and local SEO | $2,500–$7,500 | WebFX |
| Local optimized content marketing | $5,000–$10,000 | WebFX |
| Review management | $5,000–$10,000 | WebFX |
| Managed program, all channels | $2,500 / $3,500 / $5,500 | Our pricing page |
| One-time website build | $2,500–$8,000 | Our pricing page |
WebFX ranges are taken from the channel table headed “2025 Insurance Marketing Spend” on its insurance marketing budget page; the Insurance Pro Agencies figures come from the budgeting guide cited above.
Now read that against the dollar ceiling table near the top of this page. An agency at $300,000 of gross revenue budgeting 12% has $3,000 a month to work with. The review-management row alone starts above that. The reconciliation is not to buy a thin version of all eight rows — it is to buy fewer rows. We would rather run two channels funded at what the table says they cost than eight funded at a fifth of it.
The paid rows carry the widest spread for a reason: what you pay per click is set by the auction you enter, not by the size of your budget. Our cost per click by insurance line breakdown shows how far apart a final expense click and a Medicare click sit, and Insurance Pro Agencies puts insurance keywords generally at “$10-$50+ per click”. Reviews are a row worth building as a habit before buying as a service — the mechanics are in our guide to getting more Google reviews, and much of that work is process rather than spend. The compounding rows — site, SEO, content — are the ones our insurance SEO service is priced against.
How do you budget against carriers that spend a billion dollars?
You do not, and knowing the actual number is what stops you from trying.
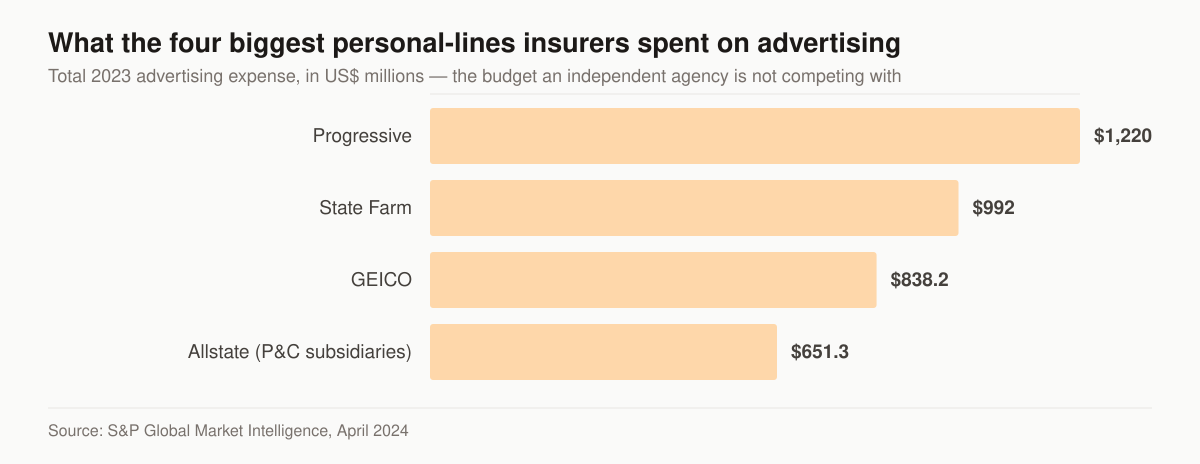
Source: S&P Global Market Intelligence analysis of 2023 advertising expense, published April 2024.
S&P Global Market Intelligence reported that the four largest US personal-lines property and casualty insurers all cut advertising in 2023, partly to offset the effects of loss-cost inflation. Progressive spent about $1.22 billion, down from $1.73 billion in 2022. State Farm spent nearly $992 million, down from $1.01 billion. GEICO’s advertising expenditure fell below $1 billion to $838.2 million, about $443 million less than in 2022. Allstate’s property and casualty subsidiaries logged $651.3 million, a 31.3% decline from $947.7 million.
Two things in that data are useful when you are setting a five-figure annual budget.
The first is that advertising is a dial even at this scale, not a fixture. All four moved it in the same year, in response to the underwriting math rather than to a marketing plan.
The second is that the dial has a visible consequence, though not a mechanical one. S&P reports that in its Form 10-K GEICO stated the significant reduction of its advertising expense over the previous two years contributed to the reduction of its policies in force, and that GEICO’s private auto policies fell 8.9% in 2022 and 9.8% in 2023. Progressive cut advertising by 29.6% year over year in 2023 and still grew private auto policies in force by 9.1%, to about 19.5 million. Spend moves the number; it does not decide it alone.
For an agency budget the practical conclusion is narrow. You are not bidding against a billion dollars on brand terms, so do not build a plan that requires you to. The money belongs on the searches, referrals and local surfaces a national brand campaign does not reach, which is the case for funding an owned channel at all — the mechanics of that are in how to rank an insurance agency website on Google.
When in the year should the money go out?
A twelfth of the annual budget every month is the default, and for a senior-market book it is the wrong shape. Enrollment windows are fixed by federal rule, so demand is not spread evenly across the year and the budget should not be either.
These are the windows that set the calendar, with the dates as the government publishes them:
| Window | Dates | Who it decides the year for |
|---|---|---|
| Medicare Open Enrollment | October 15 – December 7 | Medicare Advantage and Part D agents |
| Marketplace Open Enrollment | November 1 – January 15 | ACA and health agents |
| Medicare Advantage Open Enrollment | January 1 – March 31 | Agents working plan switchers |
| Medicare General Enrollment | January 1 – March 31 | Agents working late enrollees |
Medicare dates from Medicare.gov and its enrollment periods page; the Marketplace dates from the HealthCare.gov glossary.
Final expense and life are not gated by a federal window at all, which is why an agency writing both can let those lines carry the quiet months while the gated lines pull their spend forward. Three consequences for the budget:
- Buy the inventory before the window, not inside it. Landing pages, creative, list hygiene and conversion tracking all have to exist before October 15, because once the window opens the binding constraint is selling hours, not ideas.
- Assume a dollar buys less inside the window. Demand for those weeks is concentrated by rule, and so is every competitor’s spend.
- Do not learn anything new inside the window. The 10% experimental slice belongs in the off-season, for the reason given above.
The tactical detail for each window sits in our guides to AEP marketing strategies, the Medicare Advantage OEP rules and filling an ACA pipeline during OEP. What you may say, and when, is governed separately by CMS marketing rules — a constraint that sits on top of the budget rather than inside it.
What has to be tracked before this counts as a budget
A number you cannot attribute is not a budget line. Every calculation on this page — cost per lead, cost per sale, the affordable ceiling, the channel split — depends on the same handful of fields being captured at the point of sale rather than reconstructed at year end. Insurance Pro Agencies publishes the same list in its budgeting guide:
- Lead source on every new client
- Cost per lead and cost per bound policy, by channel
- Retention rate by acquisition channel
- Multi-policy ratio by channel
The last two do more work than they look like they do. A channel can win on cost per sale and still lose on the book: a client who arrived cheap and lapses in month fourteen cost more than one who arrived expensive and bundles. Judging channels on acquisition cost alone is how an agency quietly rebuilds its book out of its weakest clients.
Two practical constraints on making that real. The tagging has to live inside the system the agency already runs on, not a spreadsheet somebody maintains out of goodwill — our comparison of CRMs for insurance agents is the starting point for that. And the reporting cadence has to be monthly, because that is the interval at which lead economics resolve; a weekly read produces variance, not signal.
Common Budgeting Mistakes
- Judging leads by price, not cost per sale. Already covered, but it is the number-one error.
- Killing a channel after one bad week. Lead economics are monthly, not weekly. Variance is normal.
- No tracking by source. A blended CPL hides your best and worst channels. Tag everything.
- Forgetting renewals. As your book ages, renewals subsidize new acquisition. A mature agency can spend a lower percentage and still grow.
- Ignoring lifetime value. A $168 cost per sale looks steep until you count renewals and cross-sells over the policy’s life.
What should you cut first when revenue drops?
Budgets get cut. The question is the order, and the reflex order — cancel whatever is easiest to cancel — removes the compounding assets and keeps the rented ones. Ours runs the other way:
- Pause the experiments. The 10% learning slice is designed to produce no revenue this quarter, so pausing it costs nothing this quarter. It is also the first thing to restore.
- Cut brand spend before performance spend. Not because brand does not work, but because its payback arrives later than the problem you are solving.
- Take the weakest paid channel to zero rather than trimming every channel by a third. A channel funded below what it costs to run is not a smaller version of that channel. Zeroing one frees the money to defend the one that is paying.
- Protect owned assets you have already paid for. Hosting, the site, published content and the review process cost little to keep and a great deal to rebuild from scratch.
- Protect follow-up last of all. The leads you have already bought are sunk cost, and close rate is the one input that improves without any new spend at all.
The carrier data above is a useful check on the instinct to cut deepest first. Four insurers with far more data than any agency cut advertising in 2023, and GEICO’s own filing, as reported by S&P, tied that reduction to a falling policy count. A cut is a decision with a lag, not a saving.
What does it cost to hire an insurance marketing agency?
Outsourcing changes the shape of the budget, not the size of it. A managed program replaces the channel costs and the labour in the formula above with one line item. Published rates in this market generally look like this:
| Engagement | Typical cost | What it usually covers |
|---|---|---|
| One-time website build | $2,500–$8,000 | Site, tracking, core landing pages — an owned asset, not a rental |
| Entry / foundation retainer | $2,500 per month | One or two channels run properly, reporting, basic content |
| Growth retainer | $3,500 per month | Multi-channel lead generation, funnel, ongoing content and CRO |
| Full-funnel retainer | $5,500 per month | The full engine, including paid, SEO, automation and creative |
| Ad spend | Passed through at cost | Should never be marked up — ask directly, in writing |
Those are our own published bands. The one number to interrogate with any agency is the last row: if ad spend is bundled into the retainer rather than passed through, you cannot see your own cost per lead, which makes every calculation on this page impossible to run. Whether an agency beats hiring in-house is worked through against published BLS wage and benefit-load figures on our pricing page.
How much should a marketing budget be?
Set the ceiling with a percentage of revenue — 7–12% steady, 15–20% growing. Set the floor with cost-per-sale math tied to commission. Then spend toward a sales goal, not a feeling, and fix your weakest number before adding budget. Where that money actually gets deployed — offers, creative, funnel, and follow-up — is the whole of final expense marketing for agents, and the budget only works as well as the program behind it.
If you would rather not assemble the spreadsheet alone, a free marketing audit will run your current cost per lead, close rate, and cost per sale against the benchmarks here and show you which number to fix first. You can also see how this plays out in the field in our Texas final expense agency case study.
- 40 Content Ideas for Final Expense Agents You Can Steal This Week
40 content ideas for final expense agents: cost and qualifying answers, video hooks, offline angles, and the capture step that turns views into leads.
- Digital Marketing for Insurance Agents: The Channel-by-Channel Playbook
Digital marketing for insurance agents, channel by channel: which of SEO, PPC, social, email, and AI search to run first — by line and budget. Free audit.
- The Insurance Agency Marketing Plan That Fits on One Page
Build an insurance agency marketing plan in 7 steps: positioning, channels by line, quarterly budget, KPIs, compliance. Free fill-in one-page template.
- 45 Marketing Ideas for Insurance Agents, Ranked by Effort and Impact
45 marketing ideas for insurance agents, ranked into four tiers by effort and impact. Every idea notes the line it fits, from final expense to P&C.